RCG Group
RCG Group is an innovative real estate organization with over 50 years of experience operating across British Columbia, and more recently Alberta and the western United States. Specializing in the ownership, development, and management of commercial and industrial spaces, RCG is known for projects rooted in quality, innovation, and long-term functionality. Their developments are designed and built to be both enduring and environmentally sustainable. Each year, RCG publishes an environmental assessment to evaluate whether their buildings and practices continue to meet the company’s core commitment to sustainability. I was approached by RCG to design and assemble this annual report, ensuring the information was presented clearly, professionally, and in a way that reflected the organization’s values. The final report showcases RCG’s sustainability initiatives through thoughtful layout design, data visualization, and a clean visual structure, providing a document that is not only informative but also aligned with the company’s identity and long-standing environmental ethos.
PUBLICATION DESIGN INFOGRAPHIC DESGIN
2024
Design Approach
The creative direction focused on maintaining a clean, minimalist aesthetic that aligns with RCG’s core brand identity. A restrained color palette, modern typography, and spacious layouts were used to enhance readability and reflect a sense of professionalism and clarity.
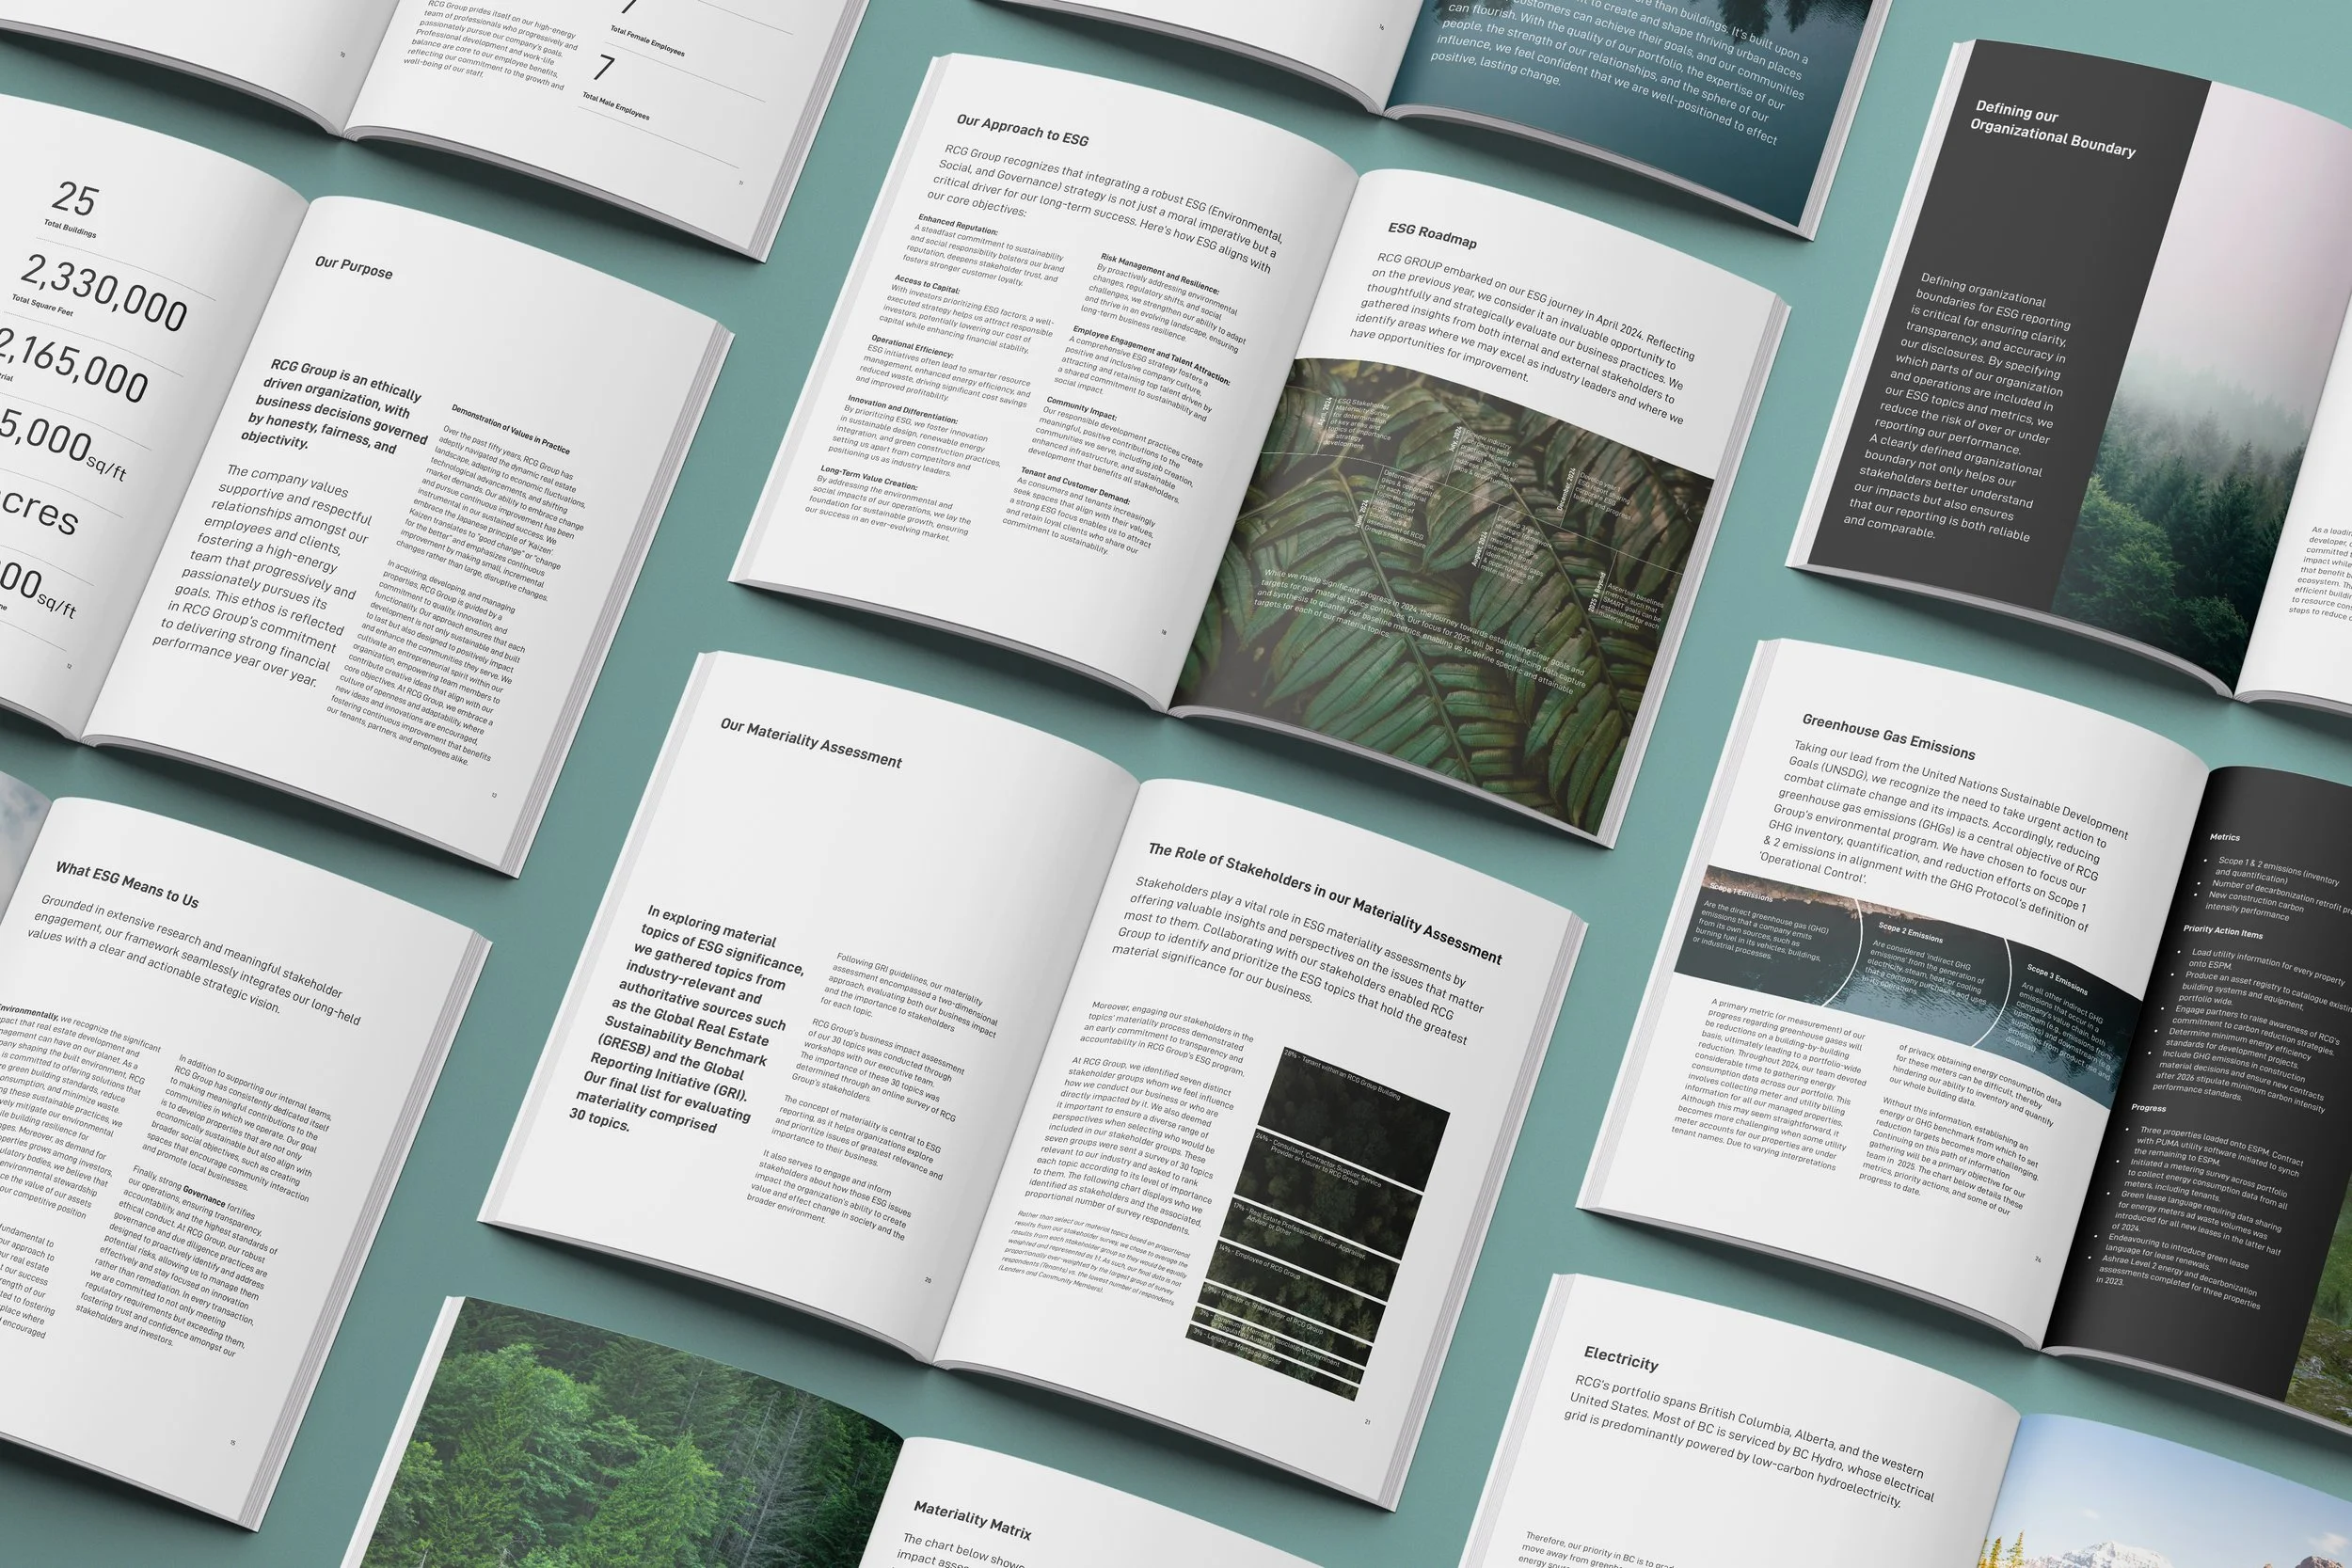
To tie the content back to the natural world, I incorporated lush, full-bleed nature photography throughout the report. These visuals forests, coastlines, and plant life, helped reinforce the environmental focus of the content, adding emotional depth and visual interest while maintaining a cohesive tone across all pages.

Custom Infographics & Data Visualization
One of the key design challenges was presenting RCG’s performance data in a way that was both engaging and easy to understand. I created a series of custom infographics specifically tailored to showcase the company’s key ESG performance indicators.
These graphics translated complex data sets such as carbon footprint reductions, diversity metrics, and community impact initiatives into clear, visually compelling visuals. By combining icons, charts, and branded graphic elements, the infographics not only supported the narrative but made the information more accessible to a broad audience, from stakeholders to the general public.
The result is a visually engaging, informative report that balances brand consistency with environmental storytelling effectively supporting RCG’s mission and message.